
Figure 2.
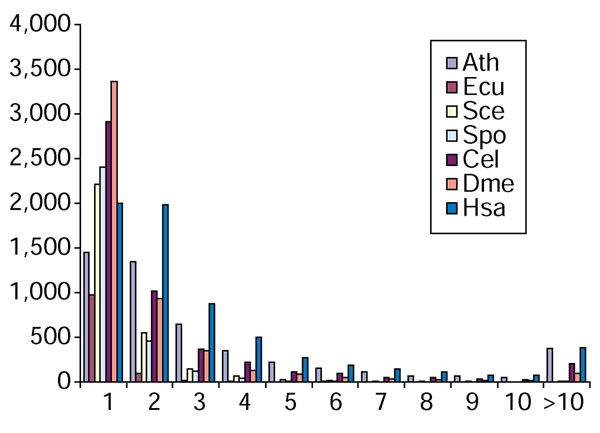
Distribution of the KOGs by the number of paralogs in each of the analyzed eukaryotic genomes. The species abbreviations are as in Figure 1.
Official websites use .gov
A
.gov website belongs to an official
government organization in the United States.
Secure .gov websites use HTTPS
A lock (
) or https:// means you've safely
connected to the .gov website. Share sensitive
information only on official, secure websites.
Distribution of the KOGs by the number of paralogs in each of the analyzed eukaryotic genomes. The species abbreviations are as in Figure 1.