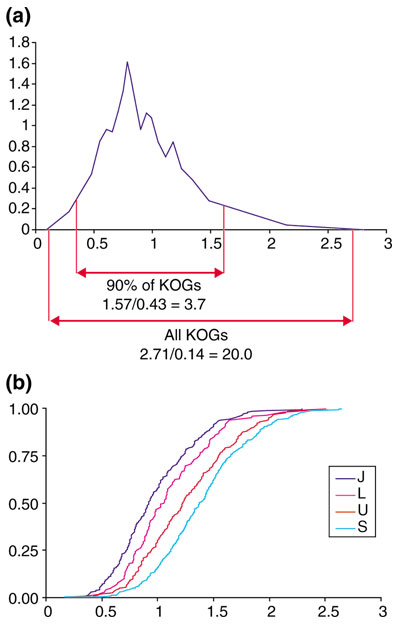
Figure 4.

Variation of amino-acid substitution rates among KOGs. (a) Probability-density function for the distribution of evolutionary rates among the set of KOGs including all seven analyzed eukaryotic species. (b) Distribution functions for the evolutionary rates in different functional categories of KOGs. The designations of functional categories are as in Figure 3.
