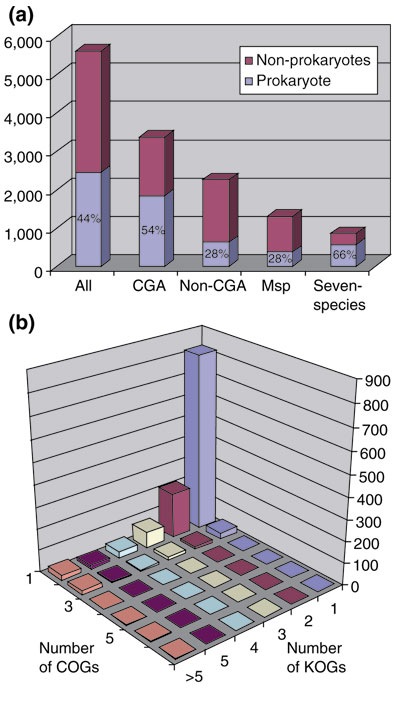
Figure 6.

Correspondence between eukaryotic and prokaryotic orthologous gene sets. (a) Representation of prokaryotic counterparts in different subsets of KOGs. CGA, crown group ancestor; non-CGA, KOGs not represented in the crown group ancestor; MSP, metazoa-specific KOGs. (b) Evidence of ancient duplications of eukaryotic genes revealed by the KOGs against COGs comparison. The connections between KOGs and COGs detected by using RPS-BLAST (see text) were analyzed by single linkage clustering.
