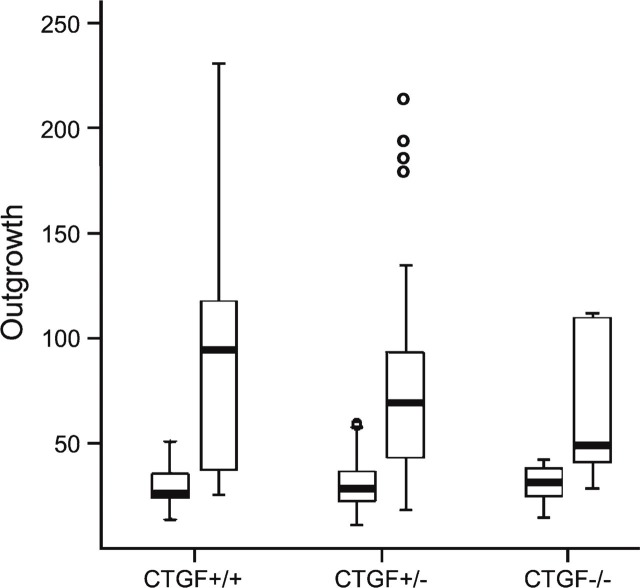
Figure 5.
Graphic representation of the differences in median area of vascular outgrowth (expressed as numbers of pixels × 1000) between the metatarsals cultured with and without VEGF for CTGF+/+, CTGF+/−, and CTGF−/− mice. Data are expressed as median with range. The box indicates values from the 25th to the 75th quartile.

