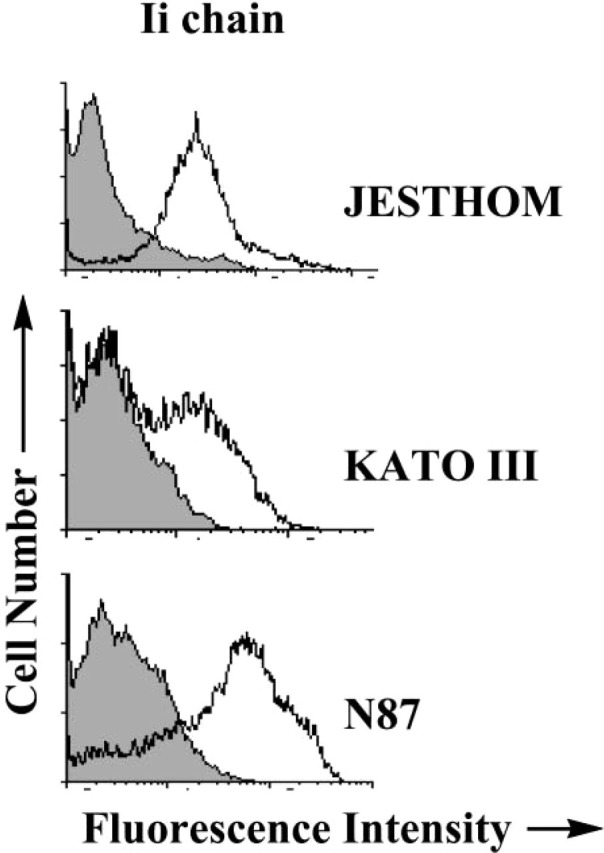
Figure 4.

Invariant chain expression by gastric epithelial cells detected by flow cytometry. Ii chain molecules were expressed in gastric epithelial cells (A) KATO III and (B) N87 before and after IFNγ treatment. For comparison (C), the Jesthom B cell line was used as an internal positive control. The cells were stained with anti-Ii BU45 mAb. The shaded curve represents the staining with the isotype control antibody. The displacement of the fluorescence intensity curve to the right indicated an increase in expression level.
