
Figure 1.
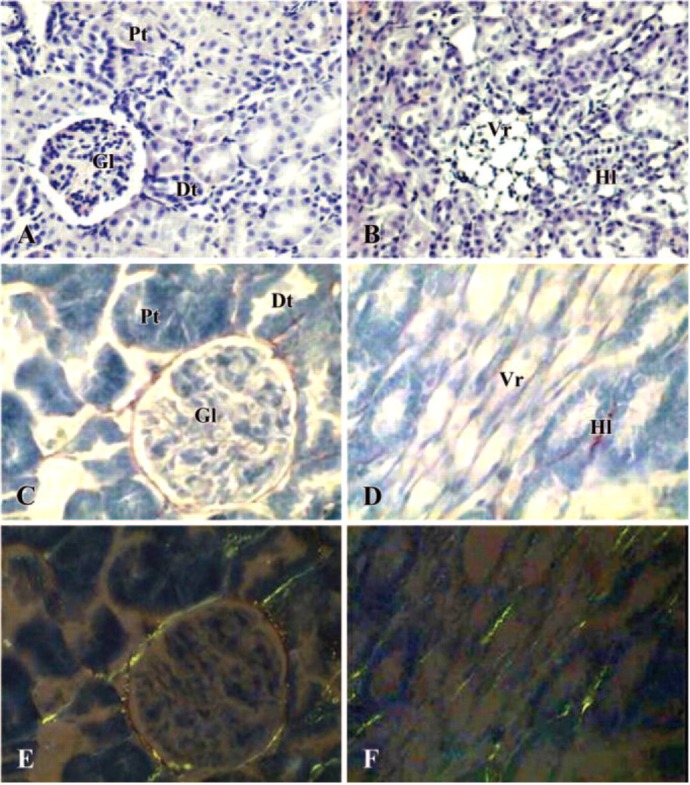
Photomicrographs of kidney in control rat. (A, B) Hematoxylin-eosin staining (×200); (C, D) Sirius Red staining under light microscope (×400); (E, F) Sirius Red staining under polarized light microscope (×400). (A, C, E) cortex; (B, D, F) medulla. Gl = glomerula; Pt = proximal tubules; Dt = distal tubules; Vr = vasa recta; Hl = Henle loops.