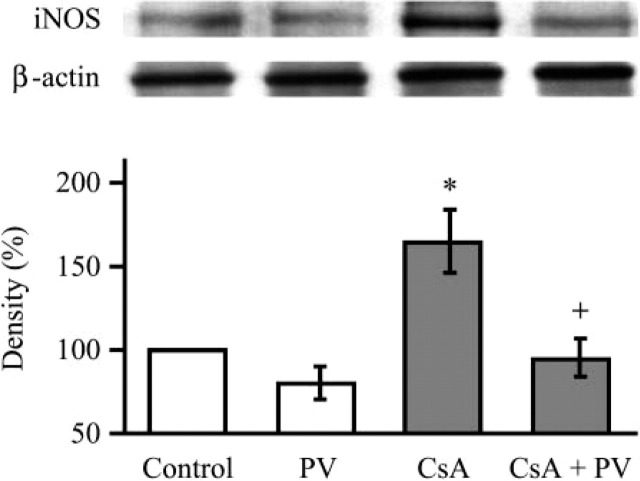
Figure 6.
Western blot analysis demonstrating the effect of Provinol and cyclosporin A (CsA) treatment on inducible NO-synthase protein expression in the kidney (with β-actin as control). Representative blots with densitometric readings are expressed as percent of control. Significant differences: ∗ p<0.05 as compared with control, + p<0.05 as compared with CsA treated group (n=5).

