
Figure 4.
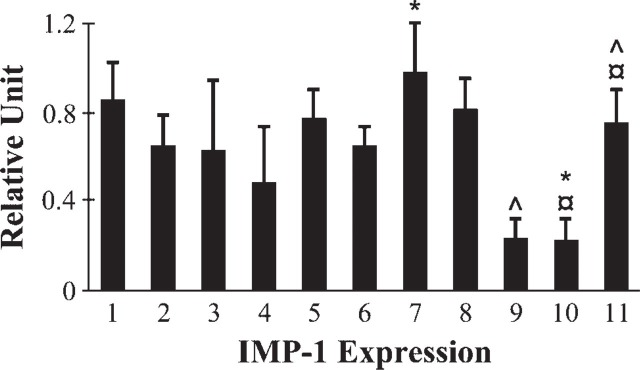
Quantification of IMP-1 mRNA expression. The level of IMP-1 expression was calculated after normalization to the glycer-aldehyde-3-phosphate dehydrogenase (GAPDH) level in each sample and presented as relative units. Fetal, 15 days (Lane 1); fetal, 16.5 days (Lane 2); fetal, 17 days (Lanes 3-5); newborn (Lanes 6-8); and adult (Lanes 9-11). Intestinal segments: proximal (Lanes 3, 6, and 9), middle (Lanes 4, 7, and 10), and distal (Lanes 5, 8, and 11). Data are means ± SE; (fetal 15 days, n = 2; fetal 16.5 days, n = 6; fetal 17 days, n = 3; newborn, n = 8 for proximal and distal, n = 7 for middle; adult proximal and distal, n = 7, middle n = 6). ^, ×, ∗ p<0.05 compared within or between the groups.