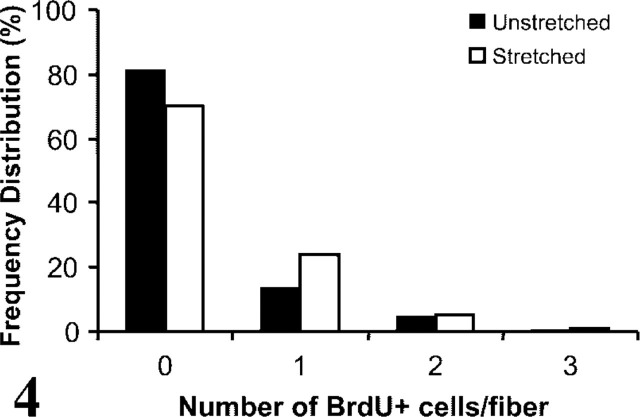
Figure 4.
Frequency distributions [proportion (%) of total fibers counted] of the number of activated satellite cells on isolated stretched or unstretched fibers. Activation was determined according to immunostaining for the incorporation of BrdU into DNA. The distribution of fibers was shifted to significantly higher numbers of activated satellite cells per fiber by 2 hr of stretching compared to unstretched conditions (p<0.05). Both distributions were significantly lower than the distribution of c-Met+ quiescent satellite cells/fiber shown in Figure 2.

