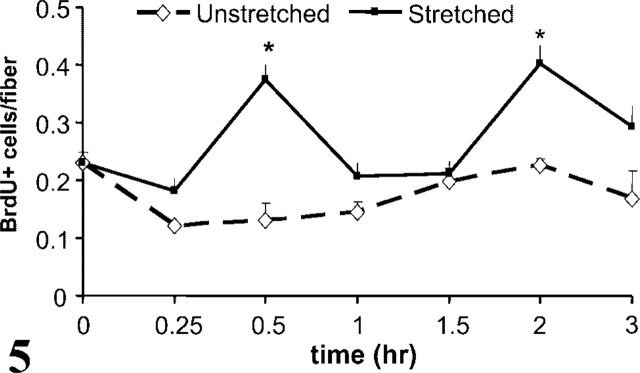
Figure 5.

Graph showing time course of the number of activated satellite cells/fiber achieved by stretched and unstretched cultures. There was a significant difference as early as 30 min after the start of stretch and a second peak of activation after 2 hr of stretch (∗p<0.05). Data (mean ± SEM) were collected from four repeated experiments, n = 5–14 wells, with 10–233 fibers each per time point.
