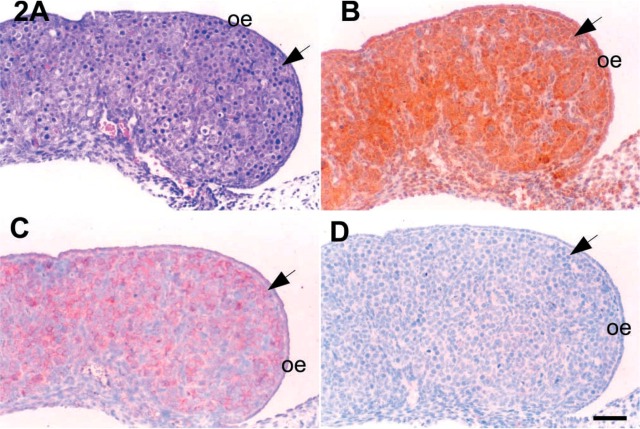
Figure 2.
Microphotographs of 14 dpc mouse ovaries. (A) Section stained with hematoxylin and eosin for identification of cellular distribution. IHC localizations for c-kit (B), SCF (C), and inhibin-α (D) were also carried out in the serial sections. Arrows, oogonia. oe, ovarian epithelium; SCF, stem cell factor. Bar = 50 μm.

