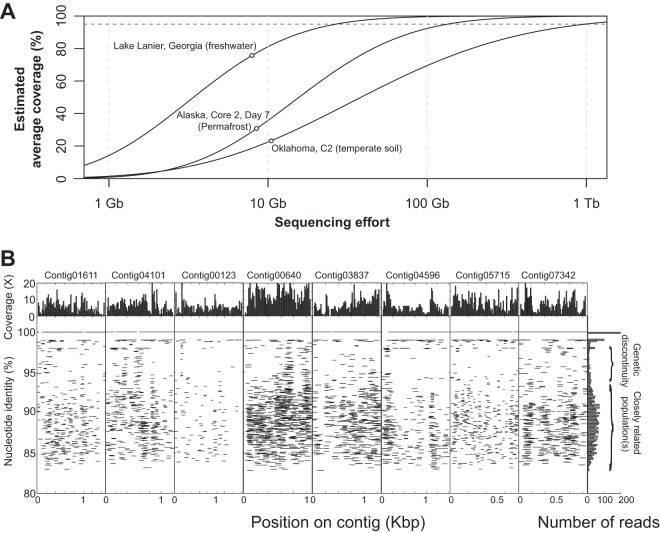
FIG 1.
Soil community complexity and dominance of sequence-discrete populations. (A) The average coverage, estimated from the portion of nonunique reads (defined as reads with at least one match at the 95% nucleotide identity level; y axis) as a function of the size of subsamples randomly drawn from metagenomes of different habitats (x axis), is shown. The solid lines indicate the fitted model based on subsampling, the empty circles mark the actual size and estimated coverage of the metagenome data sets, and the horizontal dashed line denotes the 95% average coverage level. (B) Eight contig sequences assembled from a control metagenome (C5) were used as references to recruit reads, essentially as described previously (54). The graph shows the identity of each read against the reference sequence (y axes) plotted against the position of the read on the reference sequence (x axes). The histogram on the top represents the read coverage across the length of the contigs; the histogram on the right represents the number of reads recruited per unit of nucleotide identity. Note the genetic discontinuity typically observed in the 95-to-98% nucleotide identity range.

