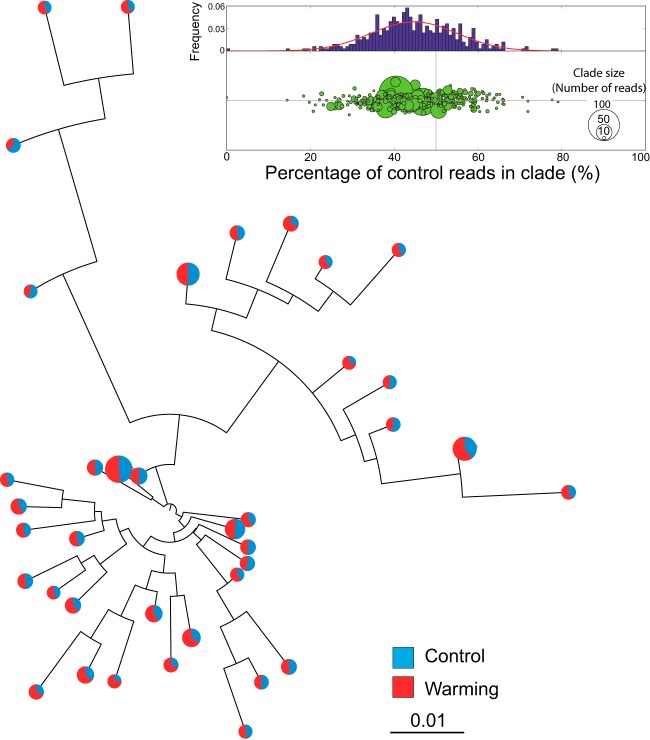
FIG 4.
Changes in pathway abundance are community wide and not attributable to only a few taxa. Representative sequences from all OTUs (or clades) of a specific gene (in this case, a CO2 dehydrogenase, CD_D) were analyzed to produce the distance-based phylogenetic tree shown. The pie charts at the tips of the tree represent the percentage of heated versus control reads that made up each OTU, and the size of each chart is proportional to the number of reads in the OTU; only OTUs with at least 50 reads are shown, for simplicity. Note that no OTU was heat or control specific and about ∼60% of the pie charts had a higher number of heated than of control reads, revealing that many distinct taxa are responsible for the higher abundance of CO2 dehydrogenase in heated metagenomes. This is also evident in the graph shown at the top (inset). In the circle graph, each circle represents an OTU; the x coordinate represents the percentage of the total reads of the OTU that are control reads, and the y coordinate represents a random value for visualization purposes. Note that more OTUs have less than 50% control reads than have more than 50% control reads. The histogram at the top shows the distribution of the percentages of control reads in all OTUs, with a fitted Gaussian curve shown by the solid line.

