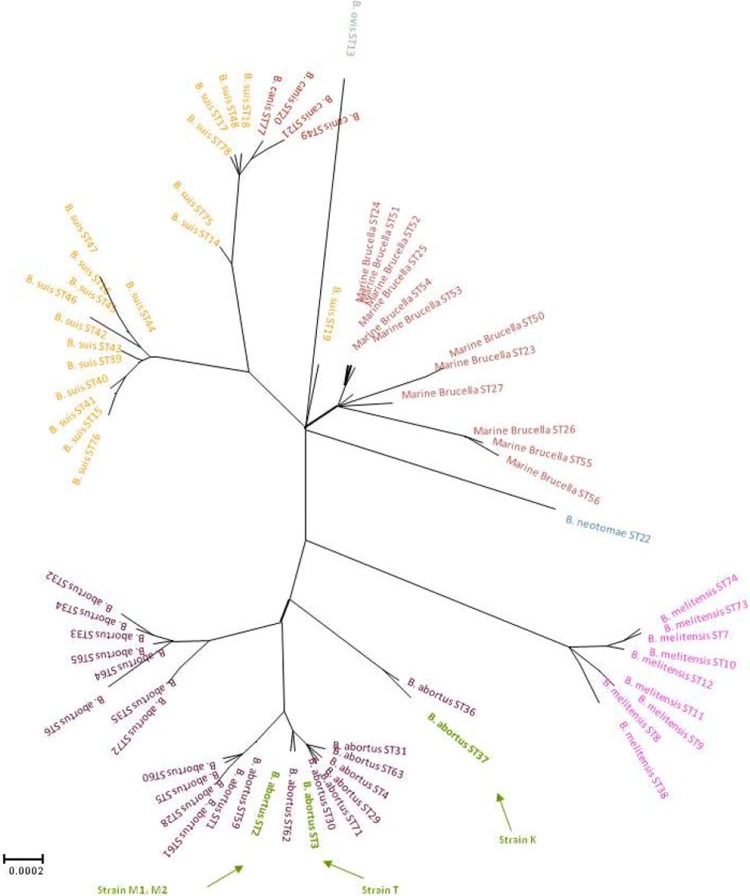
FIG 2.
Unrooted phylogenetic reconstruction of relationships between 440 Brucella isolates representing distinct species and biovars by extended MLSA. The tree was constructed with the concatenated sequence data of the 21 loci (>10.2 kb) using the neighbor-joining algorithm with the Jukes-Cantor model. Brucella species are distinguished by different colors. Strains M1, M2, T, and K investigated in this study are designated by arrows (24; Whatmore, unpublished data).

