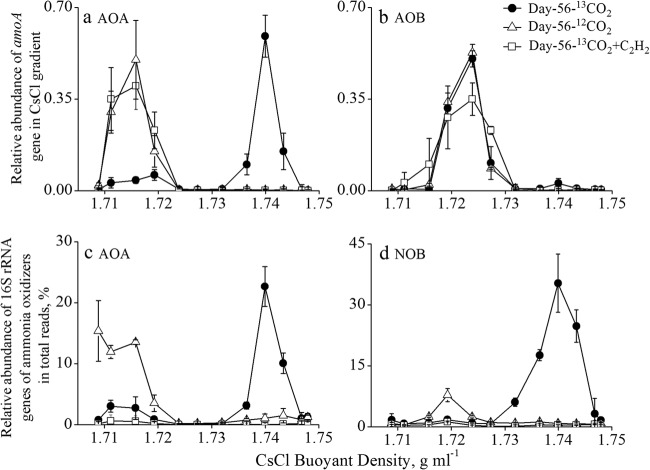
FIG 3.
Quantitative distribution of amoA (a and b) and relative abundance of 16S rRNA gene reads (c and d) of ammonia-oxidizing communities in the DNA fractions across the entire buoyant density gradient from the labeled and control microcosms after incubation for 56 days. The ratio of amoA genes in each fraction to the sum of amoA genes across the entire gradient of DNA fractions is plotted for AOA (a) and AOB (b). The relative abundance is expressed as the percentage of the targeted archaeal (c) and NOB 16S rRNA gene reads (d) to the total 16S rRNA gene reads in each DNA fraction. The error bars represent the standard errors of the triplicate microcosms.

