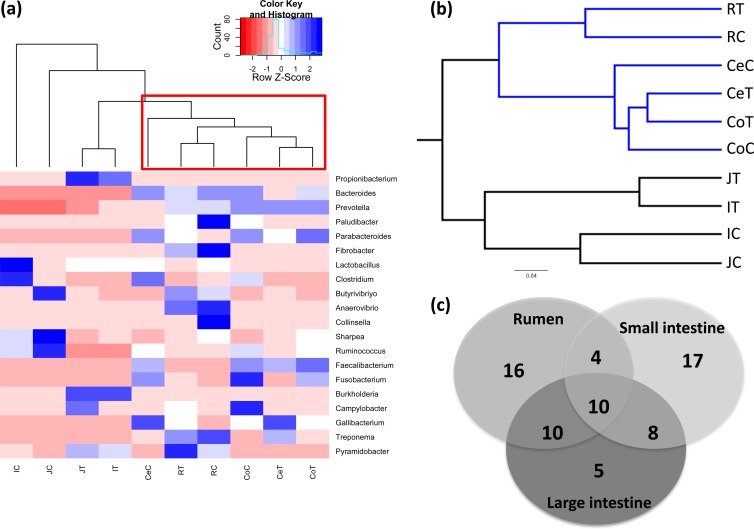
FIG 3.
Clustering of bacterial genera and OTUs present in the GIT of 3-week-old preweaned calves. (a) Heat map generated using the relative abundance (percent) of 20 abundant bacterial genera. The heat map was generated using the gplots package in R by clustering GIT regions based on the distribution and relative abundance of bacterial genera. The heat map scale displays the row Z score (Z score = [actual relative abundances of a species in a specific GIT region − mean relative abundance of the same species along the GIT]/standard deviation). (b) Clustering of all OTUs obtained from pyrosequencing of GIT samples. Unweighted pair group method with arithmetic mean (UPGMA) clustering was based on all available data with jackknifed beta diversity, which compares the diversity among the samples. (c) Comparison of the number of shared bacterial genera among the rumen, small intestine, and large intestine. The number of bacterial genera represents only the unique genera in each region, shared genera between two GIT sections, and shared genera in all the gut regions.

