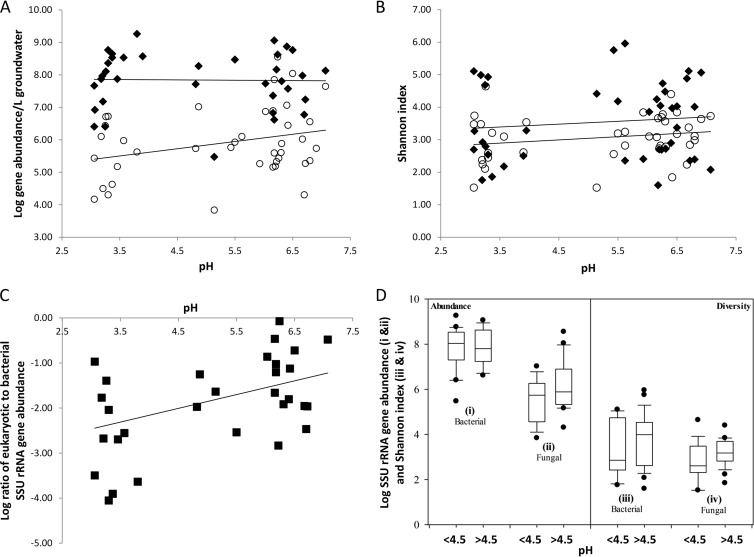
FIG 1.
Groundwater microbial diversity and abundance across the watershed. (A) Comparison of SSU rRNA gene abundance of total eukaryotes (open circles) and total bacteria (filled diamonds) in groundwater samplings from November 2008 and May 2009 plotted against pH. The slope of the regression line of total eukaryote SSU rRNA gene abundance is 0.22 (R2 = 0.08), and the slope of the regression line for bacterial SSU rRNA gene abundance is 0.003 (R2 = 0.01). (B) Fungal and bacterial diversity across the watershed compared on the basis of the number of OTUs determined from amplicon sequencing of fungal ITS regions (open circles) and SSU rRNA from bacteria (black diamonds). The linear regression for the analysis is shown (for fungi, slope = 0.03 and R2 = 0.05; for bacteria, slope = 0.1 and R2 = 0.01). (C) Ratio of eukaryotic to bacterial SSU rRNA gene abundance in groundwater samples across the watershed plotted against pH. The slope of the regression line is 0.3 (R2 = 0.2). (D) Box plots of the gene abundances of bacterial and total eukaryotic SSU rRNA (i and ii) and bacterial and fungal diversity (Shannon index) (iii and iv) by pH. Two plots were generated for each analysis, one for groundwater samples with pH values below 4.5 and one for samples with pH values above 4.5. The data are plotted as the 10th, 25th 75th, and 95th percentiles. No significant differences for gene abundance values (for bacterial SSU rRNA, P = 0.959; for eukaryotic SSU rRNA, P = 0.058) and diversity indices (for fungi, P = 0.087; for bacteria, P = 0.256) of low- and neutral-pH sites were observed.

