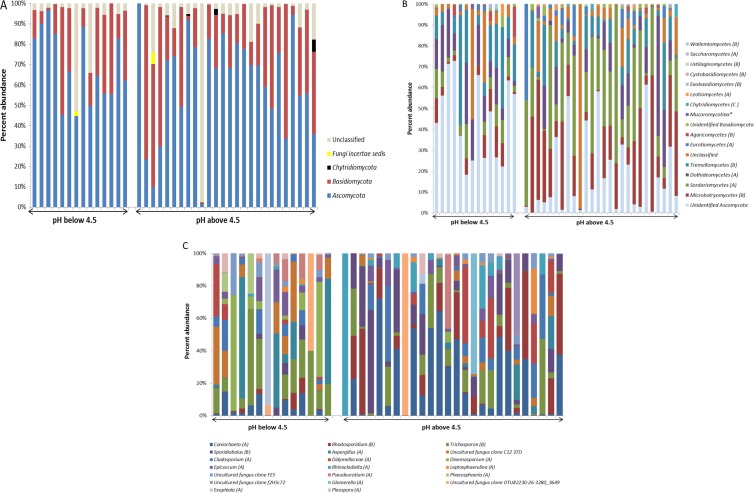
FIG 3.
Fungal community structure at various levels of taxonomic resolution. Taxa (i.e., OTUs) were classified and grouped into phyla, classes, and genera. The relative abundance of the taxa is shown for each of the 39 groundwater samples (well identifiers are described in Table S1 in the supplemental material). Groundwater samples are plotted with increasing pH and split into two broad categories on the basis of the distribution of groundwater pH values (i.e., pHs below 4.5 and pHs above 4.5). (A and B) Phylum-level (A) and class-level (B) classification of the detected taxa. In panel B, the phylum classification is indicated in parentheses (A, Ascomycota; B, Basidiomycota; C, Chytridiomycota). (C) The most abundant OTUs in the low-pH and neutral-pH groundwater samples. Percent abundance is the percentage of the classified taxa. The phylum is indicated in parentheses, as defined for panel B.

