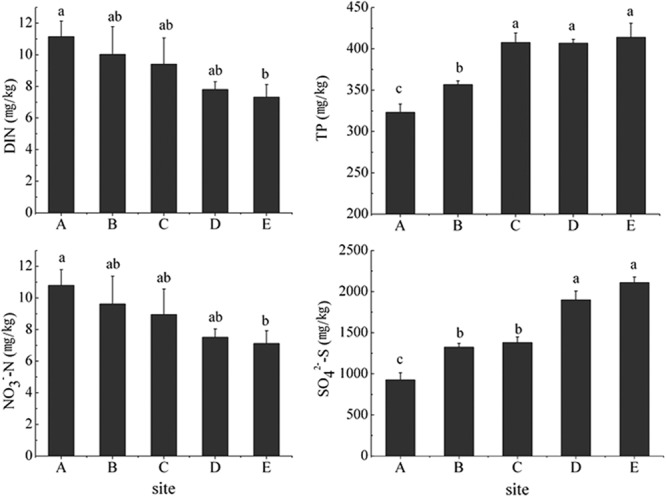
FIG 1.

Linear changes in parameters along the pollution gradient. The data represent the means ± standard deviations (n = 5). Different small letters indicate significant differences between sites for that parameter. Means were compared using one-way ANOVA; P < 0.05.
