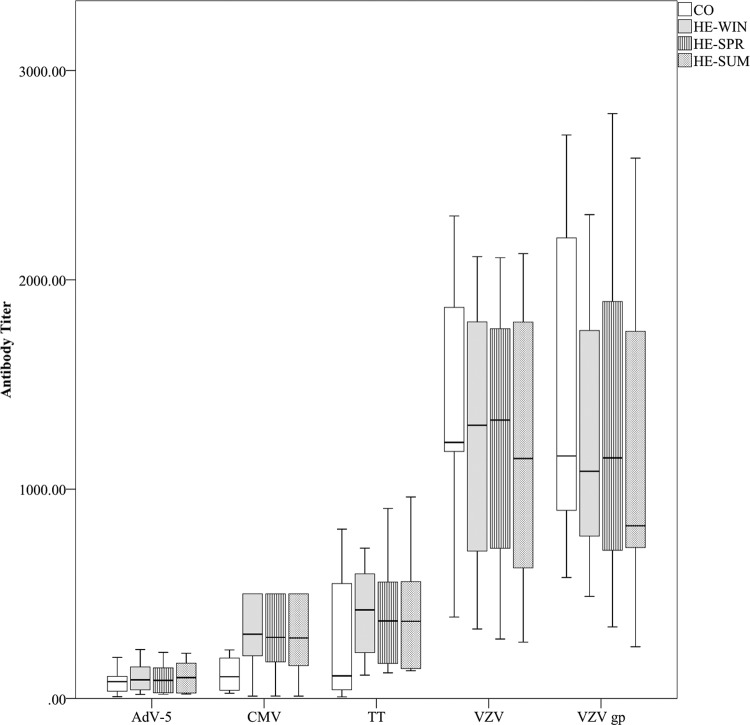
FIG 2.
Antibody detection against common pathogens. IgG titers per pathogen (AdV-5 hexon [IU/ml], CMV [IU/ml], TT [IU/100 ml], VZV cell lysate [mIU/ml], VZV gp [mIU/ml]) and per sampling group are presented using a box plot (with medians as horizontal lines, interquartile ranges as boxes, ranges as vertical lines, and outliers as dots). Data for VZV cell lysate, HE-WIN versus HE-SUM (P = 0.090). All other P values are >0.10.

