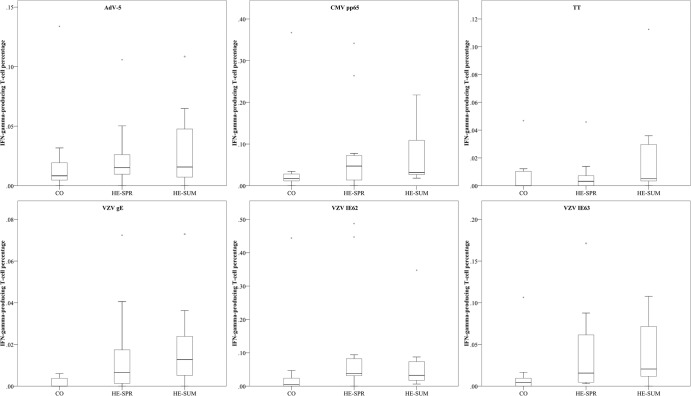
FIG 4.
Comparing IFN-γ-producing T-cell percentages (of CD3+ PBMC) between sampling groups. Box plot representations (with medians as horizontal lines, interquartile ranges as boxes, ranges as vertical lines, and outliers as dots) are used for the three different sampling groups for each antigen (AdV-5, adenovirus type 5 penton; CMV, cytomegalovirus; TT, tetanus toxin; VZV, varicella-zoster virus). Data for CMV pp65, CO versus HE-SUM (P = 0.024); for VZV gE, CO versus HE-SPR (P = 0.028); for VZV gE, CO versus HE-SUM (P = 0.019); for VZV IE62, CO versus HE-SPR (P = 0.023); for VZV IE62, CO versus HE-SUM (P = 0.034); for VZV IE63, CO versus HE-SPR (P = 0.064); and for VZV IE63, CO versus HE-SUM (P = 0.030). All other P values are > 0.10.

