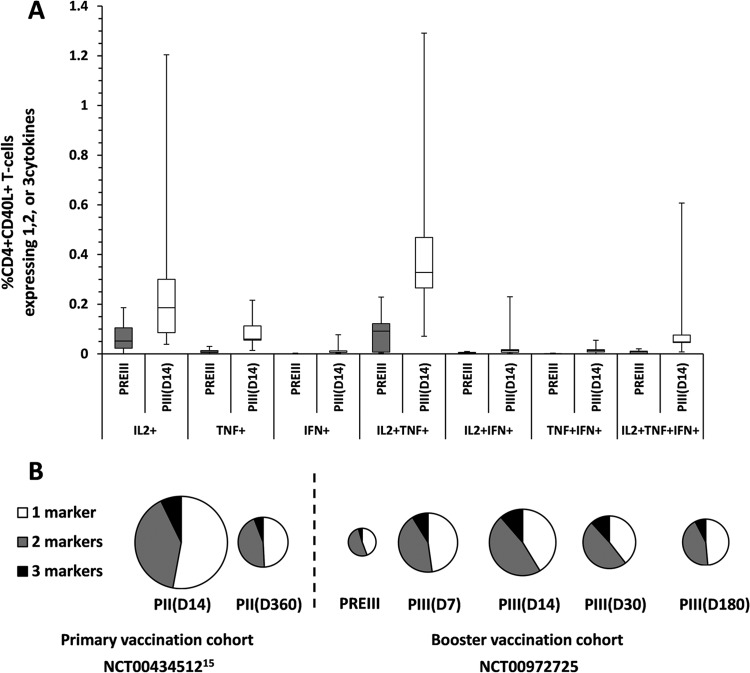
FIG 6.
(A) Cytokine coexpression profile of F4-specific CD4+ CD40L+ T cells before and following a booster dose of the F4/AS01B investigational vaccine (pooled ATP immunogenicity cohort for 10-μg-primed participants). (B) Pie chart of F4-specific CD4+ CD40L+ T-cell responses after primary vaccination in the initial study (NCT00434512 [15]) (ATP immunogenicity cohort for 10-μg F4/AS01 group) and before and after the booster dose in the present study (pooled ATP immunogenicity cohort for 10-μg-primed participants). PREII, prevaccination in the initial study; PII(D14) and PII (360), 14 and 360 days after primary vaccination; PREIII, prebooster dose given approximately 3 years post-primary vaccination; PIII(D7), PIII(D14), PIII(D30), and PIII(D180), 7, 14, 30, and 180 days after the booster dose. The percentage of CD4+ CD40L+ T cells expressing cytokines in response to the fusion protein F4 was determined by adding the individual frequencies of the CD4+ CD40L+ T-cell response to each of the four individual antigens. In the box plot, the central box shows the interquartile range (Q1 to Q3), with the thick horizontal line representing the median (Q2) and the whiskers (above and below the box) representing the maximum and the minimum, respectively. Pie charts represent percentages as proportions.

