
Figure 2.
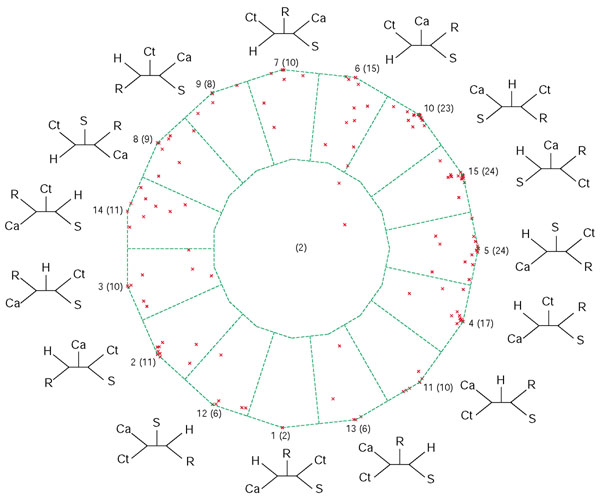
Posterior probability map for the analyses of five photosynthetic genomes: Synechocystis sp., Chloroflexus aurantiacus, Chlorobium tepidum, Rhodobacter capsulatus and Heliobacillus mobilis. Each QuintOP is represented by a point inside the dekapentagon (there are a total of 188 points for 188 sets of orthologs common to the five genomes [5]). The dekapentagon is divided into zones of proximity to topologies: points that fall into one of the 15 zones that correspond to the 15 tree topologies favor either that topology most or several neighboring topologies, and points that fall into the single central zone represent unresolved relationships. The tree topology number (1 to 15) is given first, followed by the number of points per zone in parentheses. Tree topology numbers correspond to the abbreviations described in [5]. Abbreviations: Ca, Chloroflexus aurantiacus; Ct, Chlorobium tepidum; H, Heliobacillus mobilis; R, Rhodobacter capsulatus.