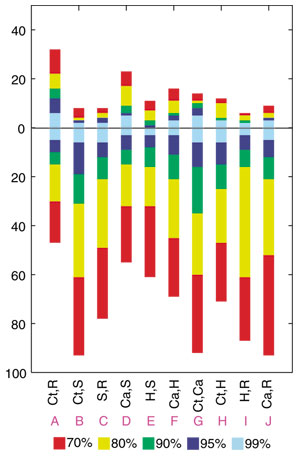
Figure 4.

Modified Lento-plot for a genome quintet with five photosynthetic bacteria. We summarized the results for 15 trees into 10 possible bipartitions. Each bipartition is labeled on the modified Lento plot [29] by the two taxa that group together (the other three taxa are in an unresolved trifurcation), and by a letter A through J. For each bipartition, the bar above the x-axis gives the number of datasets that support the bipartition and the bar below the x-axis indicates the number of datasets that conflict with this bipartition. This conflict value is calculated as the sum of support for all conflicting bipartitions. The levels of support are color coded. Every bipartition is represented by at least several datasets with significant support. The plurality bipartition (grouping Chlorobium with Rhodobacter) is supported by 32 datasets with bootstrap support 70% or better. However, even more datasets support its conflicting bipartitions, and therefore appear in conflict with the plurality topology. Abbreviations as in Figure 2.
