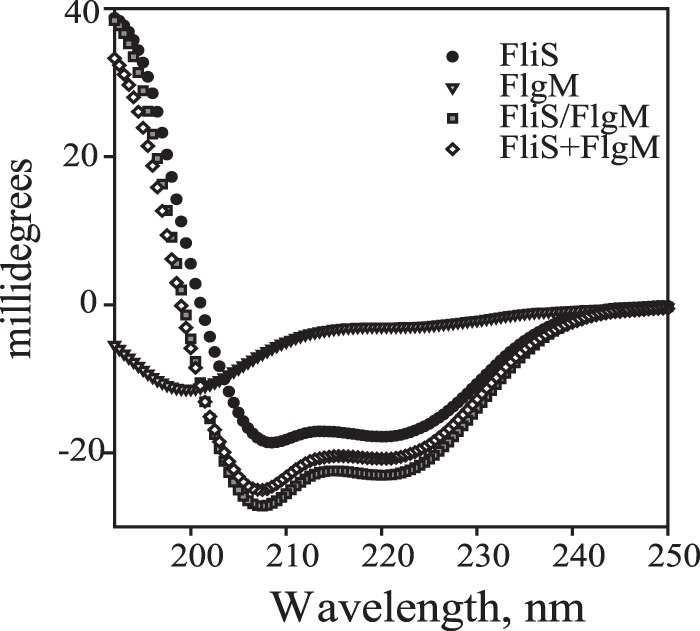
FIG 4.

CD spectra of 5 μM FlgM and 5 μM FliS separately and in complex in 50 mM Tris-HCl (pH 7.5) containing 100 mM NaCl. The difference in the spectra of the complex of FlgM and FliS (FliS/FlgM) and the sum of individual curves (FliS+FlgM) indicates the change in the secondary structure.
