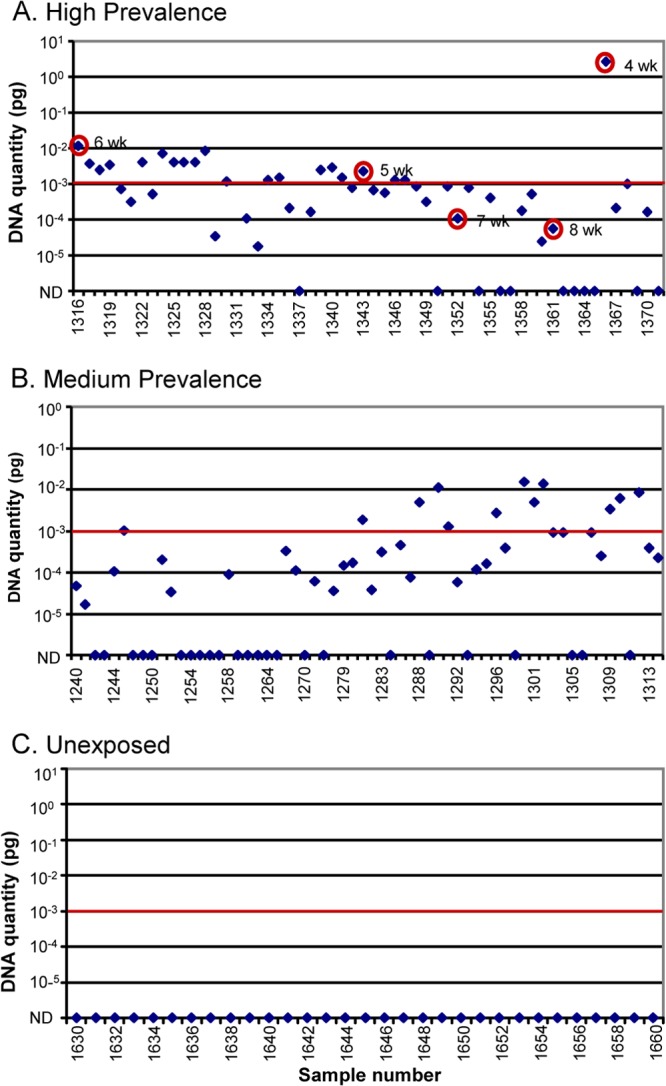
FIG 6.

HT-J and culture results for samples from three cattle farms with differing disease prevalence: high prevalence (A), medium prevalence (B), and unexposed (C) to M. avium subsp. paratuberculosis. The quantity of DNA determined from the M. avium subsp. paratuberculosis DNA standard curve is shown on the y axis, and sample numbers (animal no.) are shown along the x axis. The PCR result of each individual animal is shown as a dot. The positive/negative cut point is shown as a horizontal line. (A) Culture-positive samples are circled with weeks of growth in radiometric culture indicated. ND, not detected.
