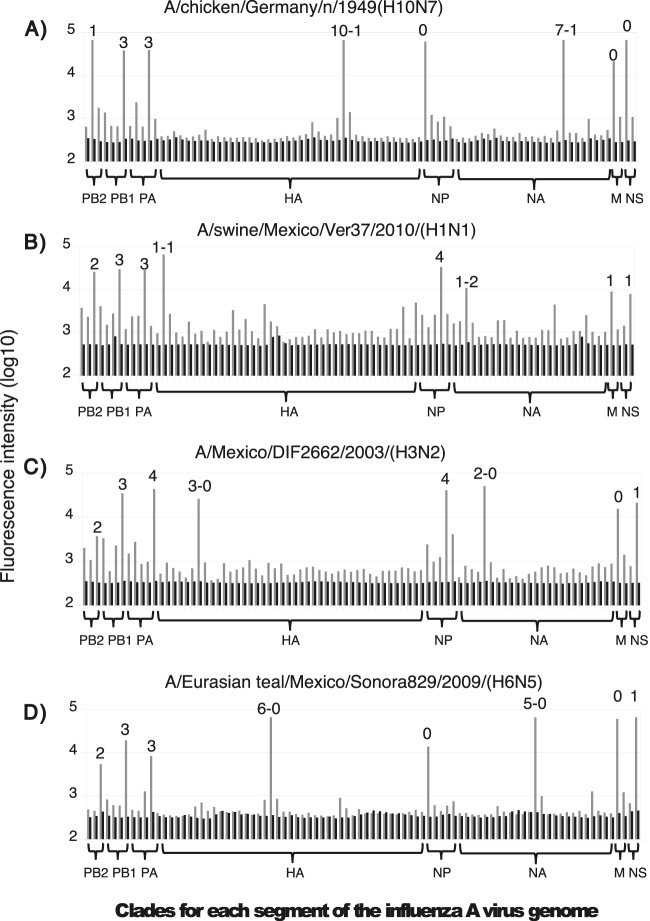
FIG 4.
Microarray hybridization specificity. Shown are the signal and background fluorescence intensities for the hybridization spots defining the different clades (numbers on top of bars) of each gene segment. The names of the strains used to illustrate the hybridization pattern for the reference (A), swine (B), human (C), and avian (D) influenza viruses are indicated. The clade assigned for each segment of the four strains is shown. Gray bars, signal; black bars, background.

