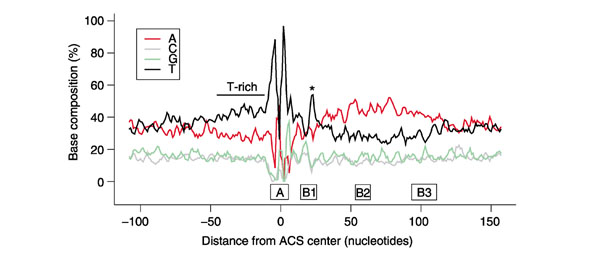
Figure 6.

Augmented sequence profile of known and predicted yeast replication origins. The 26-member training set and 208 experimentally supported predictions were combined, and their nucleotide frequencies were moving-averaged in a 3 nucleotide window. We used a 3 nucleotide window because it was the minimum needed to produce a relatively smooth plot. Shown is the 268 nucleotide region analyzed by Oriscan; the positions of A and B elements in ARS1 [48] are indicated below the horizontal axis. A peak in the frequency of T residues between the ACS and the A-rich region corresponding to the WTTT consensus within the B1 element is indicated by an asterisk, and a T-rich region is noted 5' to the ACS.
