
Figure 1.
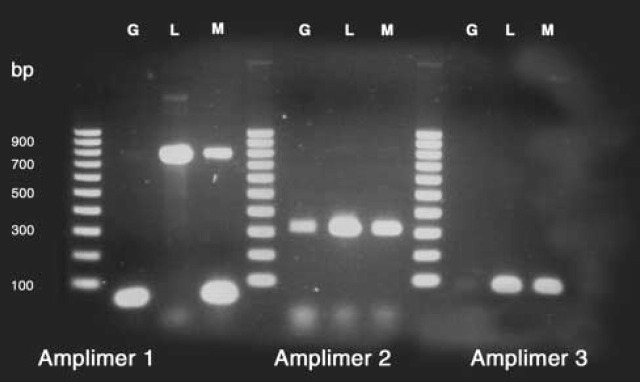
Three amplimers identifying mRNA of MCT1 in granulocytes (G), lymphocytes (L), and monocytes (M). The oligonucleotide standards in lanes 1, 5, and 9 are 100-bp increments from 100 to 1000 bp. The blurry bands near the bottom are excess primers, while the strong bands just above that level in lanes 2 and 4 are primer-dimers of 90 bp. The expected amplimer sizes were, respectively, 799, 331, and 94, and presented strong bands for L and M. The corresponding bands for G are quite weak, but upon extraction and sequencing, gave exact matches to the database sequence, as did the strong bands. See Table 3 for further amplimer data.