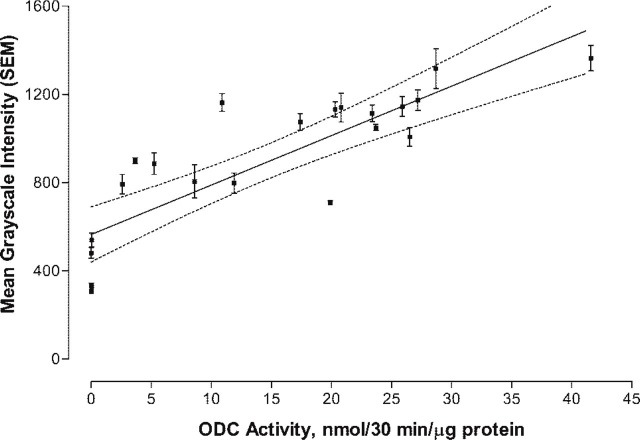
Figure 2.
Linear least-squares plot of transgenic heart activity (nmol/30 min/μg protein) versus ODC-Ab-Alexa 647 intensity. The plot represents 22 heart samples. The integrated and bit-mapped intensity for each of three ×40 magnified fields/heart sample (1700 total measurements/heart) were used to compute a mean ± SEM. Dashed line represents the 95% confidence interval for the regression line that was fitted to the equation Y = 564.8 (±59.8) + 22.4 (±3.2) × ODC activity, with R 2 = 0.71.

