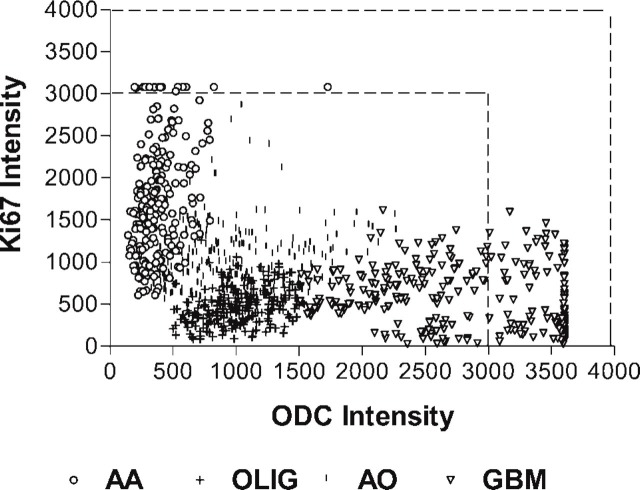
Figure 6.
Scatterplot of ODC-Ab-Alexa 647 intensity versus Ab-Ki67-PE intensity for three, anaplastic astrocytoma (AA), oligodendroglioma (OLIG), anaplastic oligodendroglioma (AO), and glioblastoma (GBM) tumors from the tissue array. Because there were no statistical intergroup differences within a histology, the results from the tumors were pooled and plotted as a single histologic group. The dotted lines bracket intensities that represent fluorescent saturation.

