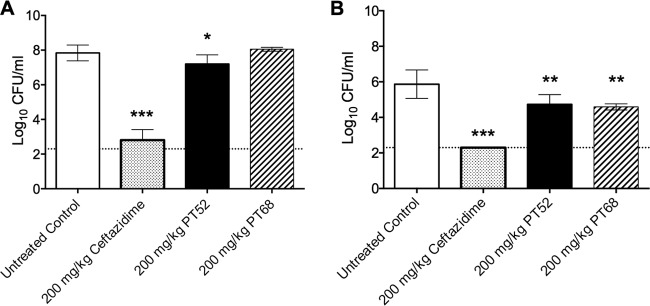
FIG 2.

Bacterial burden in mouse lung (A) or spleen (B) at 60 h postinfection. The mean of each group was plotted, with error bars indicating ± standard deviations and a dashed line indicating the level of detection. Significance was determined by one-way ANOVA and a P value < 0.05. These data are representative of two independent experiments.
