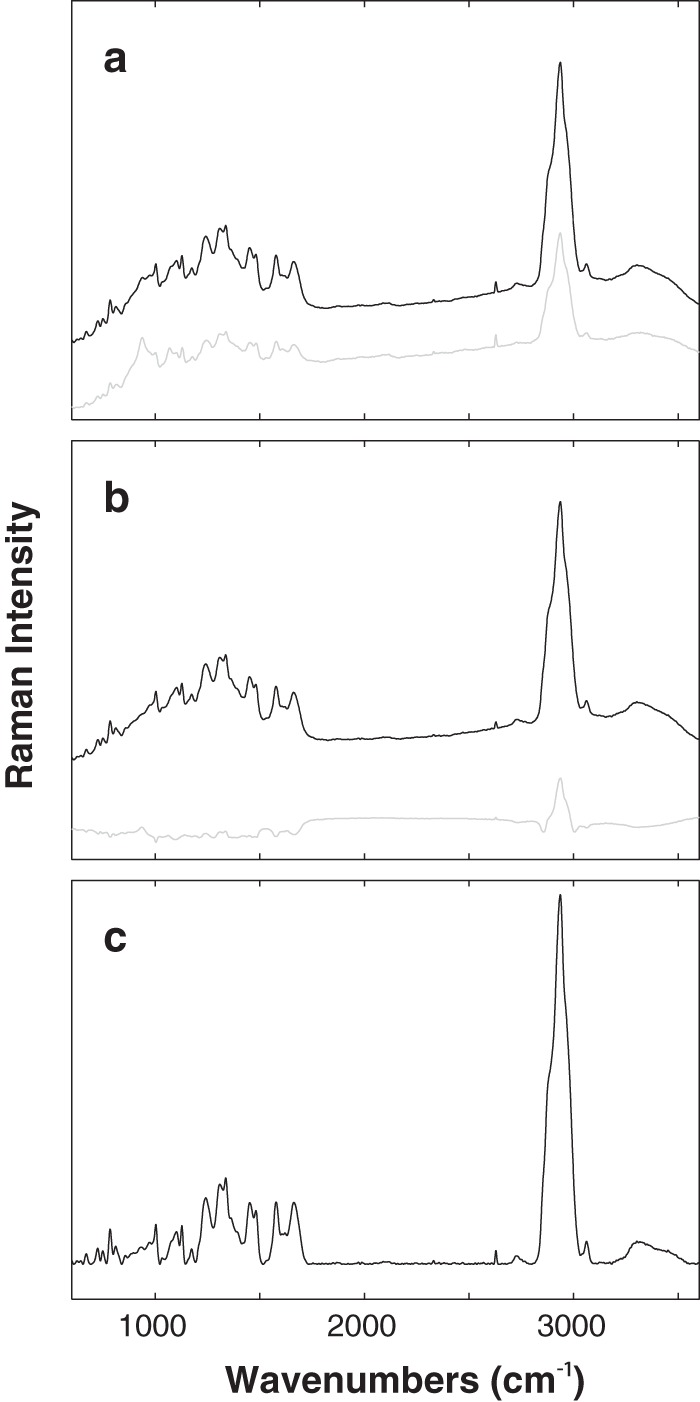
FIG 1.

Preprocessing Raman spectroscopy data. The average spectrum (black line) of 131 independently obtained Raman spectra of the control E. coli culture (i.e., untreated with antibiotic) before normalization (raw data) (a), after normalization (b), and after baseline correction (c). Intensity variation between individual spectra is indicated by the standard deviation spectra (gray line) shown in panels a and b.
