
FIG 5.
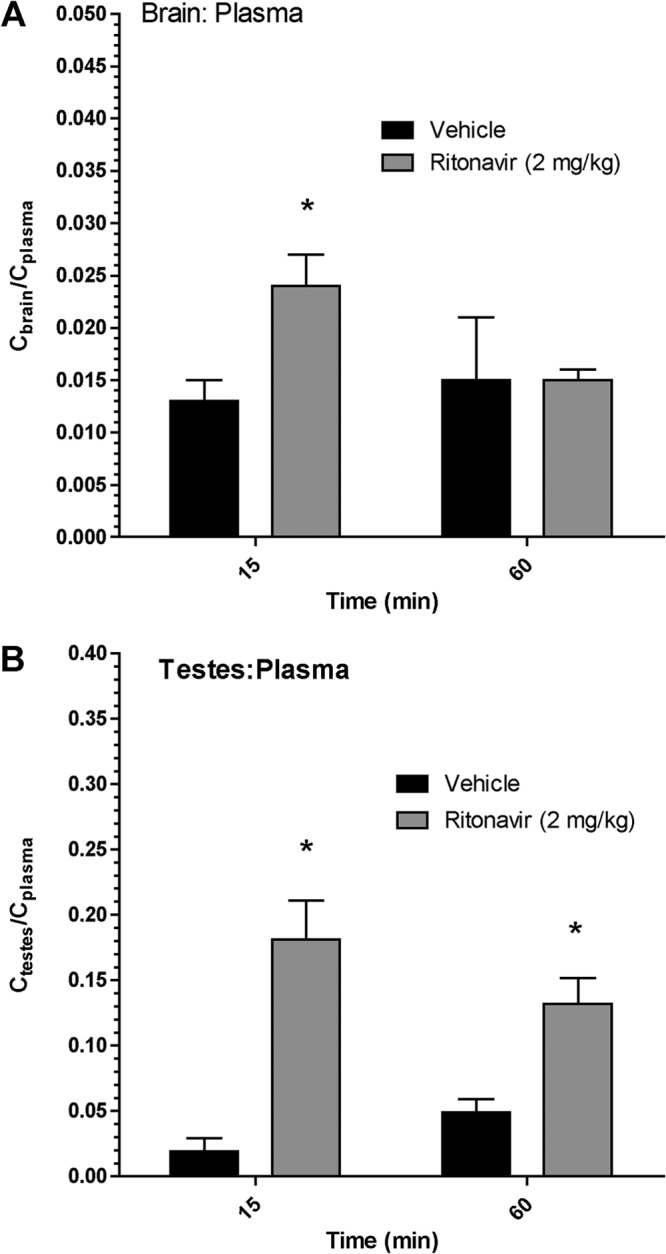
Effect of ritonavir on atazanavir tissue-to-plasma concentration ratios in WT and TKO mice. Atazanavir Cbrain/Cplasma (A) and Ctestes/Cplasma (B) ratios at 60 min in Cyp mice in the absence (vehicle) or the presence of ritonavir (2 mg/kg i.v.) are shown. Results are expressed as the mean tissue concentration/plasma concentration ratio ± SEM (n = 4 mice per time point per group). Statistically significant differences are indicated by an asterisk (*, P < 0.05).