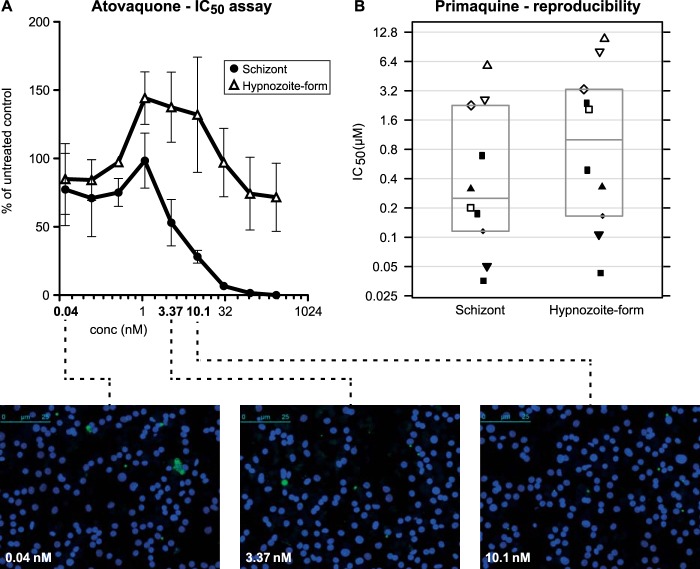
FIG 2.
P. cynomolgi liver stage drug assay validation. (A) Atovaquone sensitivity profile of large EEFs and hypnozoite forms. Three independent atovaquone IC50 assays were averaged and are shown here (± standard deviations [SD]) with representative images of assay wells. Developing EEFs are more sensitive to the compound than hypnozoite forms. At higher atovaquone concentrations, only small parasites are visible. (B) Reproducibility of the primaquine IC50 assay. Ten independent P. cynomolgi primaquine in vitro liver stage drug assays were performed. IC50s were determined for individual assays and plotted. Indicated are the mean values and the 95% confidence intervals. IC50s from the same experiment for schizonts and hypnozoite forms are indicated with identical symbols. Note that the IC50 for hypnozoite forms is always higher than for schizonts within a single assay.

