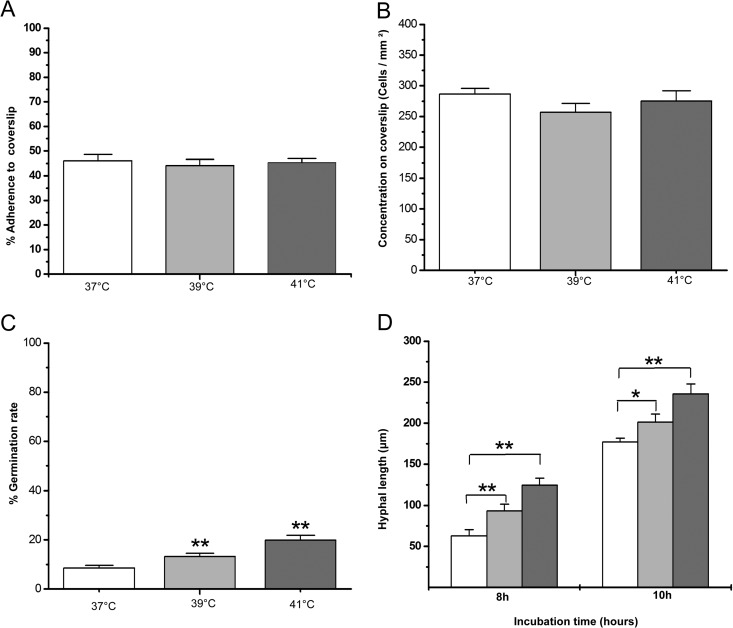
FIG 3.
The dynamics of A. fumigatus cells in biofilm formation at different mild heat stresses. The results were quantified in triplicate by FUN-1 staining. The values that are significantly different by Student's t test are indicated by asterisks: *, P < 0.05;**, P < 0.01. Light bars represent 37°C, light-gray bars 39°C, and dark-gray bars 41°C. (A) Adherence rates. The rates were also normalized with the cell number observed in CLSM by the following formula: amount of cells adhered to coverslips/total cells inoculated in tested well. (B) The concentration of cells on the coverslips was calculated by the number of cells in CLSM assay by the following formula: amount of cells in photographed area/area size. (C) The germination rate of A. fumigatus cells was quantified with CLSM by the following formula: amount of germination cells/total in area. (D) The hyphal lengths of each experimental condition at 8 and 10 h were measured by CLSM.

