
FIG 8.
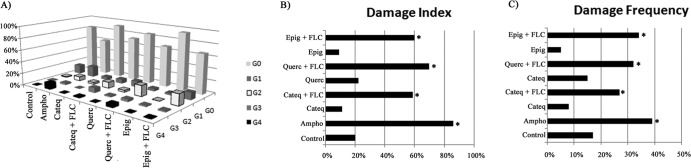
Effects of different treatments on the distribution of damage classes (grades [G] 0 to 4) of DNA caused by fluconazole after 24 h of exposure. The yeasts were exposed to RPMI (negative control), fluconazole (64 μg/ml), CATEQ, QUERC, and EPIG (128 μg/ml), amphotericin B (4 μg/ml; positive control), and a fixed concentration of CATEQ, QUERC, and EPIG (128 μg/ml) with fluconazole (16 μg/ml) for 24 h. *, P < 0.05 compared to the control by ANOVA followed by the Newman-Keuls test.