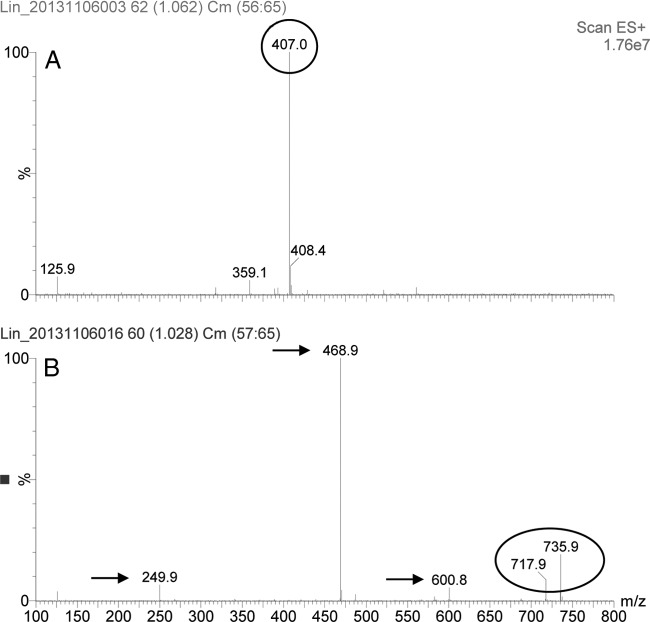
FIG 3.
UPLC-MS/MS analysis of S. aureus RN4220+pAM401 cells (control sample) (A) and S. aureus RN4220+pAM401-lnu(E) cells (B). The 407.0-Da peak in panel A represents the nonmodified lincomycin, whereas the 735.9-Da and the 717.9-Da peaks in panel B represent the nucleotidylated lincomycin and the nucleotidylated lincomycin which has lost one H2O molecule, respectively. Results are shown for fragments observed after CID. Fragments indicated by arrows are believed to result from leakage of the adenine or the adenosine moiety of the compound.

