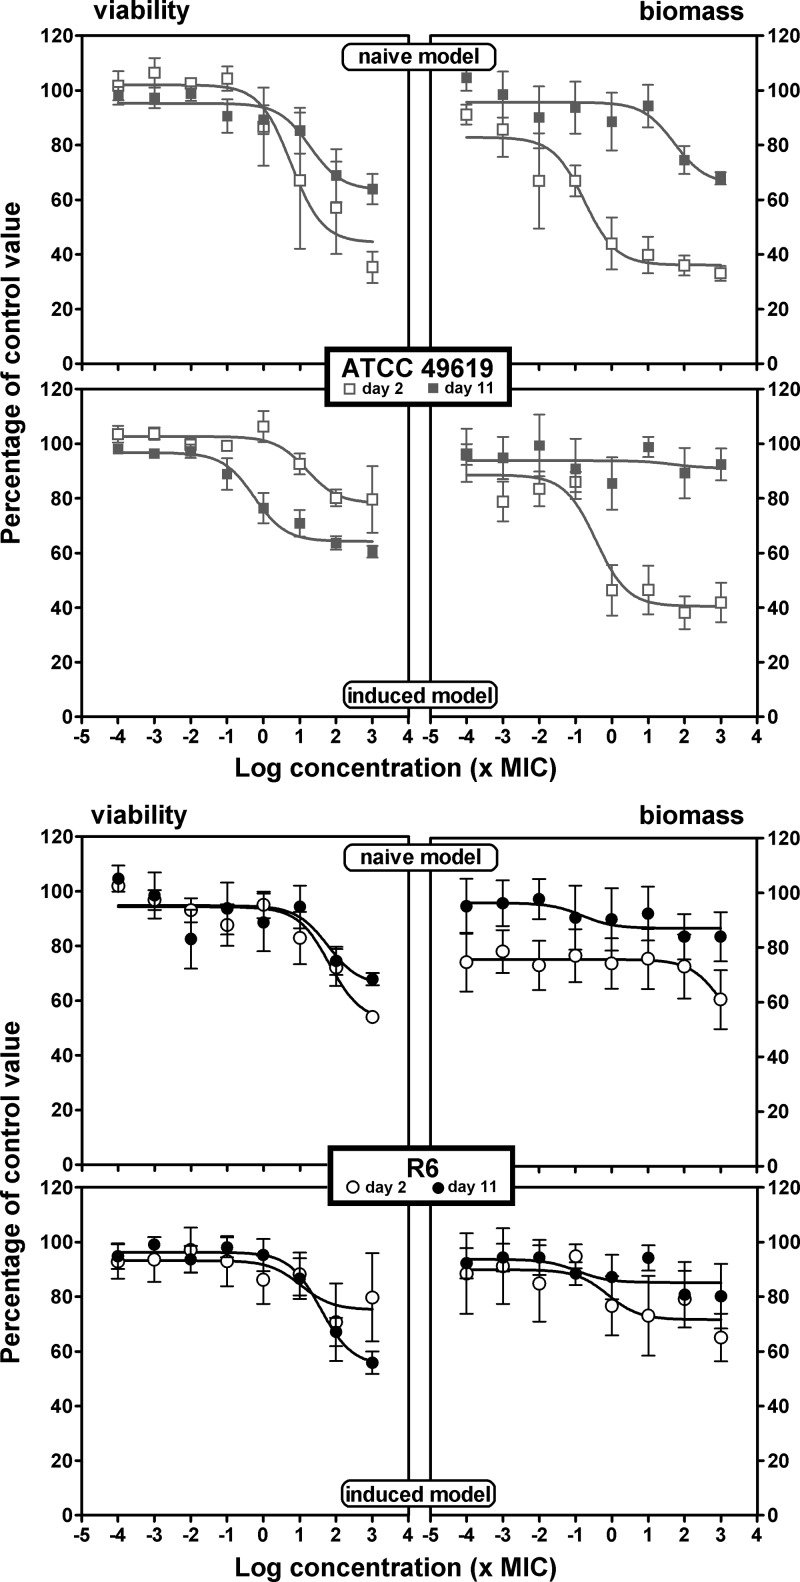
FIG 4.
Concentration-response activity of solithromycin against biofilms of ATCC 49619 (top) or R6 (bottom). Two-day-old (open symbols) or 11-day-old (closed symbols) biofilms from the naive model (upper panels for each strain) or the induced model (lower panels for each strain) were incubated with increasing concentrations of solithromycin for 24 h. The ordinate shows the change in viability (measured by the decrease in resorufin fluorescence [left panels]) or in biofilm mass (measured by the decrease in crystal violet absorbance [right panels]) as a percentage of the control value (no antibiotic present). All values are means ± SEM of 4 to 10 independent experiments performed in quadruplicate. When not visible, the error bars are smaller than the size of the symbols. The pertinent pharmacological descriptors of the curves are presented in Tables S1 and S2 in the supplemental material.

