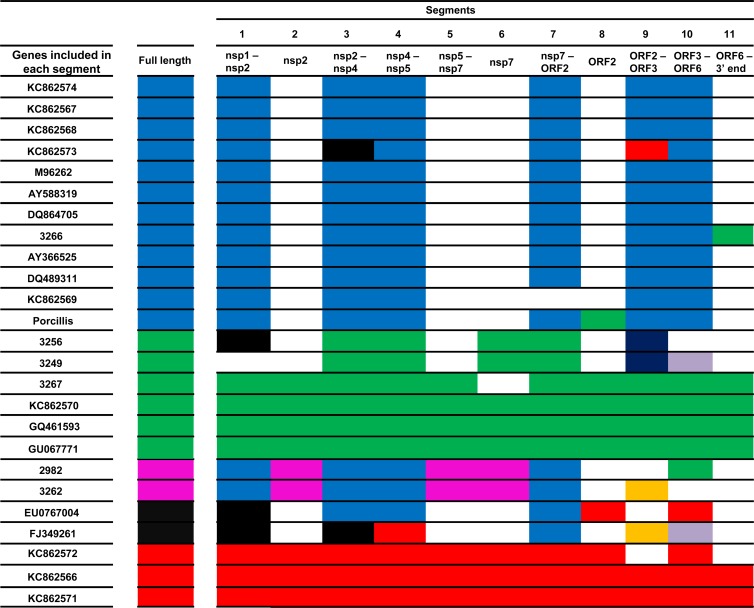
FIG 6.
Clustering of the full-length genotype 1 strains and the 11 different segments determined by the breakpoints obtained with the GARD analysis is shown by means of a color code. Blue, green, pink, black, and red were first determined by the clustering observed in the full-length ML tree (1,000 iterations) based on the biggest groups determined by bootstrap values of >65. Clustering of full-length genomes then was compared individually to the other 11 segments. A matching color of a strain in full-length sequence and a segment means they have the same clustering. A change of color means a change of clustering and further evidence of recombination. White indicates that no clustering was determined that was supported by bootstrap values of >65. Other colors mean new clustering not observed in the full-length tree.

