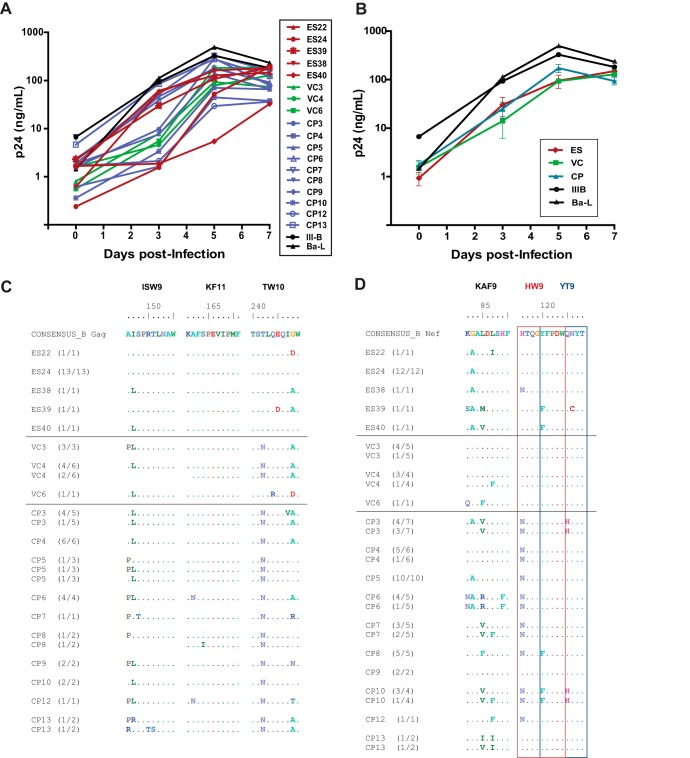
FIG 1.
(A) Growth kinetics of 18 HIV-1 isolates cultured from CD4+ T cells from HLA-B*57+ patients. The patients were ES (red), VCs (green), or CPs (blue). Two laboratory strains (black) were included for comparison. The isolates were all cultured in activated CD4+ T cells from the same HIV-1 negative donor. (B) Median growth curve for each group of patients. (C and D) Sequence variation within the three HLA-B*57-03-restricted Gag (C) and Nef (D) epitopes for each isolate. The red and blue boxes denote two distinct but overlapping Nef epitopes, HW9 (116 to 124) and YT9 (120 to 128), respectively. Comparisons of the degree of sequence variation were made using the Mann-Whitney test.

