
FIG 3.
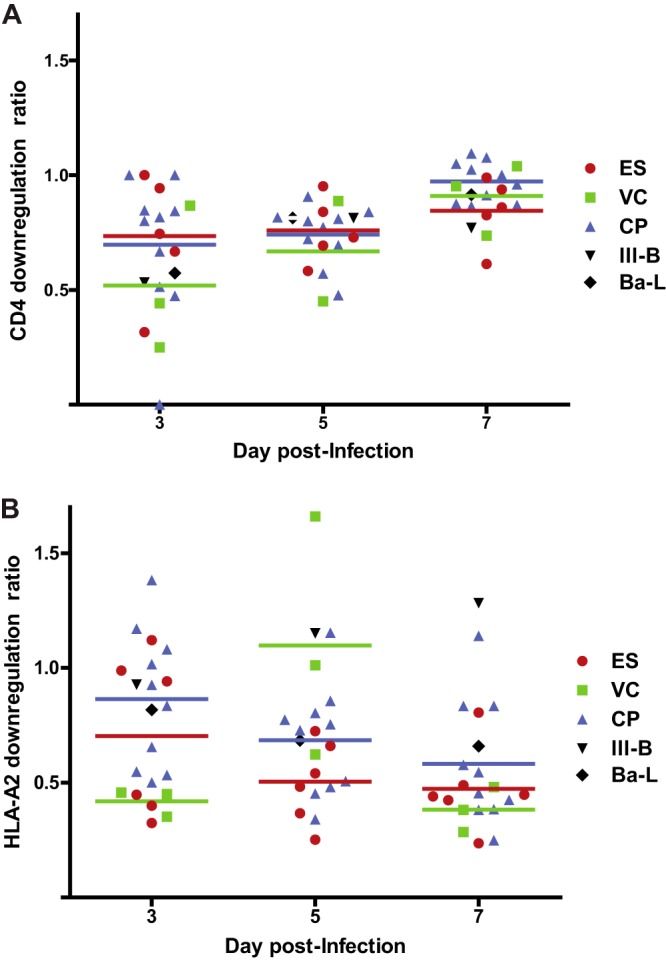
Downregulation of CD4 and HLA-A2 in primary CD4+ T cells infected with HIV-1 isolates. The isolates were laboratory isolates (black) or HIV-1 isolates cultured from ES (red), VCs (green), or CPs (blue). Each symbol represents an individual isolate. The HLA-A2 downregulation ratio (A) is the MFI of HLA-A2 on cells that were positive for intracellular Gag divided by the MFI of HLA-A2 on CD4+ T cells that were Gag negative. The CD4 downregulation ratio (B) represents the fraction of all CD4+ T cells that were Gag positive and CD4 low. The horizontal lines represent the median level of downregulation for each group of patients. The Mann-Whitney test was used to compare the degrees of CD4 and HLA-A2 downregulation in the different patient populations.