
FIG 1.
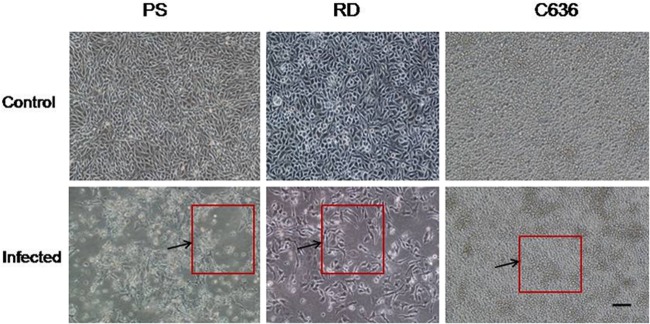
Susceptibility of different cell lines to Malsoor virus based on cytopathic effect (CPE) with 10× magnification. Cells were infected at a multiplicity of infection of 10. The areas of CPE were seen as microfoci of clearing in PS cells showing cellular changes (lower left panel) and distinct rounding of RD cells showing cellular changes on the 3rd p.i.d. (lower middle panel). There was no cytopathic effect in C6/36 cells on the 4th p.i.d. (lower right panel). The cultures were monitored for CPE until the 7th p.i.d. The arrows and the boxes outlined in red indicate areas of CPE. The magnification bar for all photomicrographs represents 1 μm.