
FIG 2.
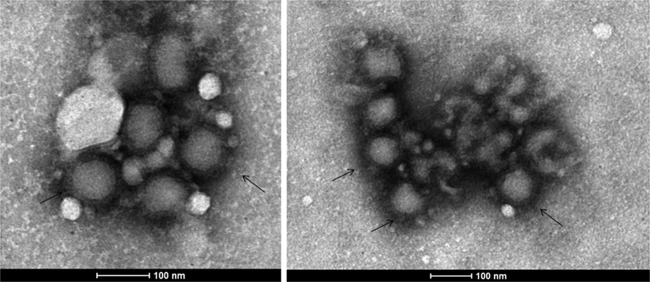
Representative transmission electron micrographs showing a typical negative stain showing bunyavirus particles in Vero CCL81 cells at the 4th p.i.d.. Scale bars are integrated into the micrograph. The arrows indicate representative bunyavirus particles showing distinct envelopes.