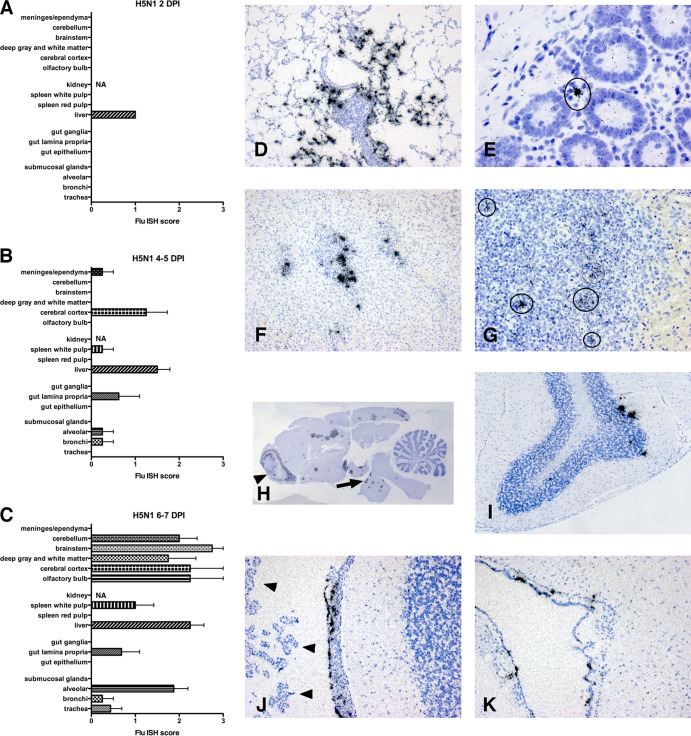
FIG 2.
Histograms delineate the average ISH score for different regions of organs 2 (A), 4 to 5 (B), and 6 to 8 (C) days after primary H5N1 infection. In the first 2 days after infection, influenza virus RNA was not widely observed by ISH. At 2 DPI, no infected cells were detected in the lung and a mild infection was detected in the liver. By 4 to 5 DPI, influenza RNA was readily detected in a broad range of organs, including brain, spleen, liver, small bowel lamina propria, and occasionally in the lung. During terminal stages, 6 to 7 DPI, virus was more abundant in many organs, especially the brain. (D to G) ISH for viral RNA in paraffin sections from different systemic organs. (D) Lung at 4 DPI demonstrates influenza virus RNA mostly in lung alveoli. (E) Small bowel at 7 DPI demonstrates influenza virus RNA in lamina propria cells between glandular epithelium. (F) Liver at 5 DPI shows infected cells in regions of hematopoiesis and periportal inflammation. (G) Spleen at 4 DPI shows infected cells (circles) mostly in follicles of white pulp. (H to K) ISH for viral RNA in paraffin sections of the brain at 5 to 6 DPI. (H) Whole mount preparation shows abundant infection of olfactory cortex (arrowhead) and, in multiple sites throughout the cerebral cortex, deep gray matter and brainstem (arrow). (I) Cerebellum shows multiple infected cells in the Purkinje layer. (J and K) Ependymal cells lining the ventricles and cells within the leptomeninges demonstrate viral RNA hybridization while choroid plexus (arrowheads) shows no hybridization. All ISH slides were counterstained with hematoxylin. Scoring: 0 = no definitive signal, 1 = occasional focus, 2 = focus in most fields, 3 = more than one focus per field.

