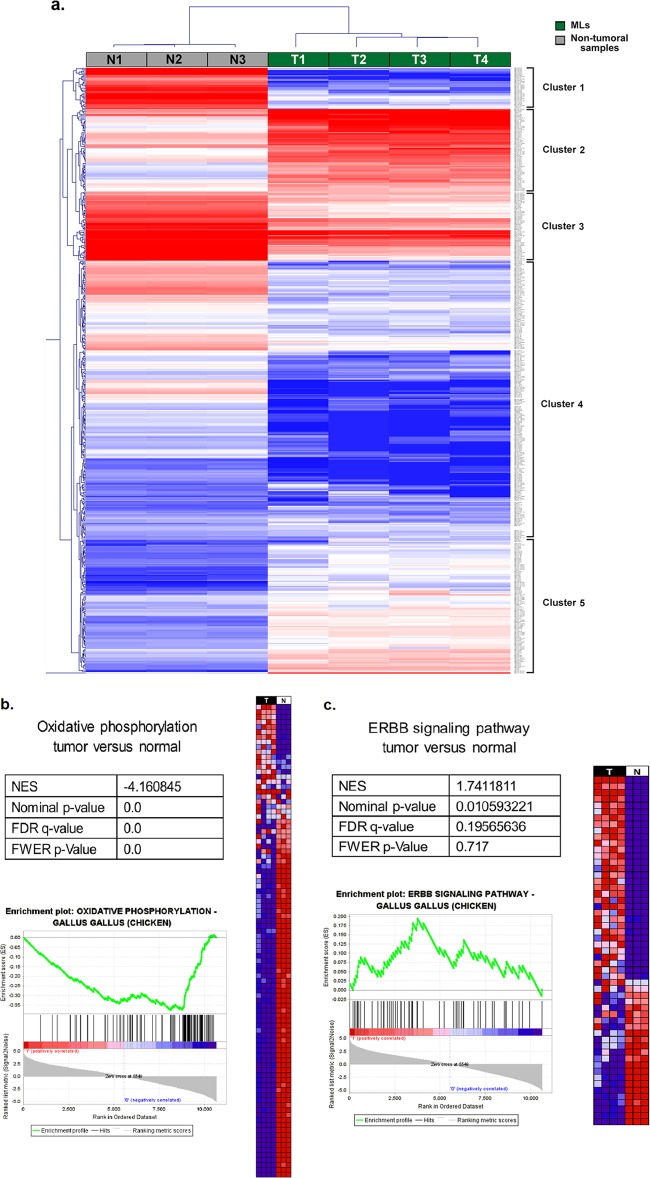
FIG 3.
Transcriptome deregulations in ALV-J-induced ML tumors. (a) Heat map and dendrogram showing hierarchical unsupervised clustering analysis of ALV-J-induced ML tumors and nontumor samples. Expression levels in the heat maps are color coded from blue (low) to red (high). (b) Expression profile of ALV-J-induced ML samples (T, in black) compared to three nontumor samples (N, in white) by GSEA. Heat map representations of the most upregulated (top) and downregulated (bottom) genes of oxidative phosphorylation between the two groups (from blue, low expression, to red, high expression) are shown. GSEA statistics: NES, normalized enrichment score; FDR q value, false discovery rate; FWER P value, family-wise error rate. The enrichment plot at bottom shows the overrepresentation at the top and bottom of the ranked gene set. (c) Expression profile of ALV-J-induced ML samples (T, in black) compared to three nontumor samples (N, in white) by GSEA. Heat map representations of the most upregulated (top) and downregulated (bottom) genes of the ErbB signaling pathway in tumors versus expression in nontumor samples are shown. The enrichment plot is as described for panel b (see also Table S5 and Note S1 in the supplemental material).

