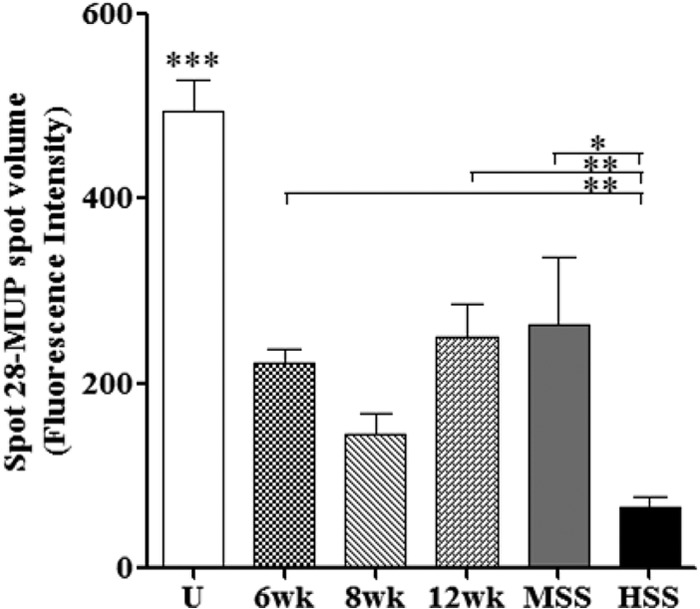
FIG 1.

Liver candidate markers in different study groups in a mouse model, illustrating results of ANOVA followed by the Newman-Keuls pairwise multiple-comparison test (3). Shown are comparisons of spot volumes of mouse liver cytokeratin 18, interleukin 2 (IL-2), major urinary protein (MUP), Schistosoma mansoni phosphoenolpyruvate carboxykinase (PEPCK), peroxiredoxin 6, and liver hydroxyproline for uninfected (U), 6-week-infected (6wk), 8-week-infected (8wk), 12-week-infected (12wk), and 20-week-infected mice with moderate splenomegaly syndrome (MSS) and hypersplenomegaly syndrome (HSS). Data shown are means ± standard errors of the means (SEM). P ≤ 0.01 (overall ANOVA). Individual groups were compared using the Newman-Keuls multiple-comparison test. ***, P ≤ 0.001; **, P ≤ 0.01; *, P ≤ 0.05 (compared to all other study groups and as indicated). (This figure and its legend are reprinted or modified from reference 3 with permission.)
