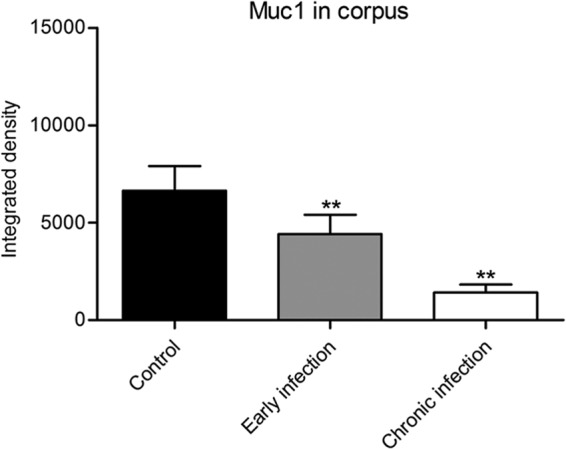
FIG 2.

Quantification of Muc1 during early and chronic Helicobacter pylori infection, illustrating results of ANOVA followed by Dunnett's multiple-comparison test with a control (4). The integrated densities of fluorescence as a measure of Muc1 in the corpus during early and chronic infection are compared. Data were compared to control values (n = 6) by ANOVA with Dunnett's post hoc test (**, P < 0.01; NS, not significant). (This figure and its legend are reprinted or modified from reference 4 with permission.)
