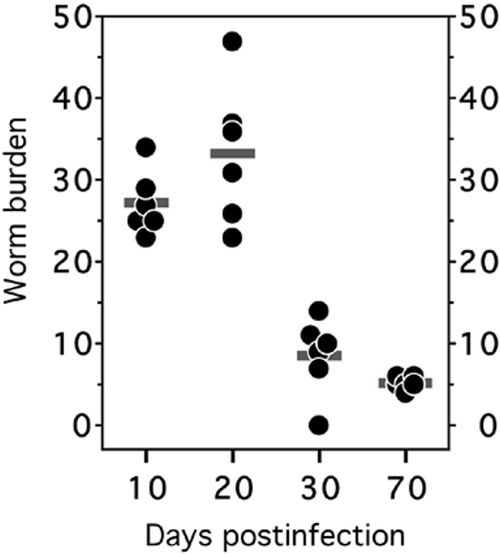
FIG 3.

Intestinal worm burden of infected hamsters (5). At each time point postinfection, six infected hamsters were sacrificed and adult hookworms removed from the intestines. The horizontal bars represent the mean numbers of adult worms for each group. Days with higher mean worm burdens tend to have more-variable data, indicating that ANOVA on the raw data may be problematic and that ANOVA on log-transformed data may be preferable. (This figure and its legend are reprinted or modified from reference 5 with permission.)
