FIG 5.
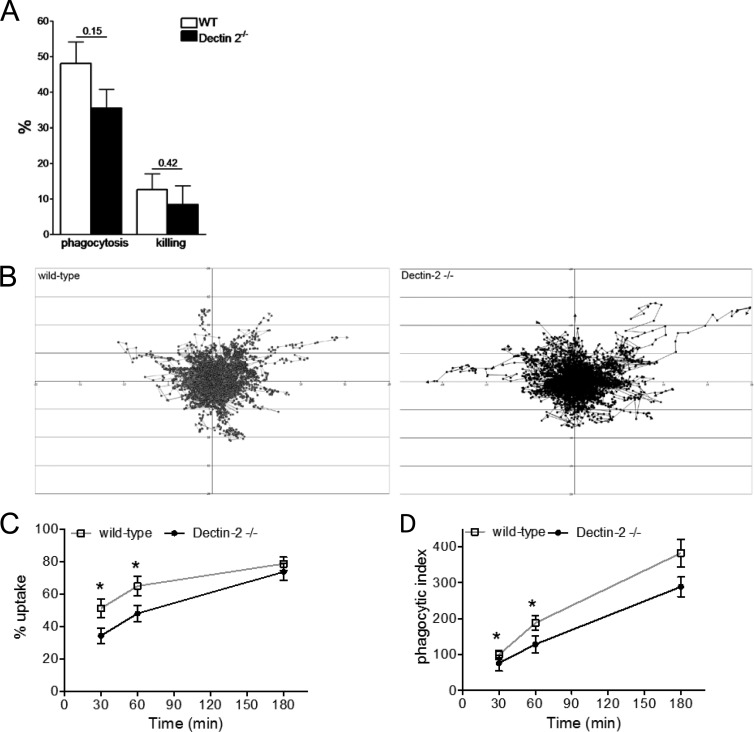
Impact of Dectin-2 deficiency on phagocytosis and killing of C. glabrata by peritoneal macrophages. (A) Phagocytosis and killing of C. glabrata cells by murine peritoneal macrophages. The results are represented as percentage of phagocytosis (the percentage of fungal cells engulfed by macrophages present in the well) and percentage of killing (the percentage of killed fungal cells among the phagocytosed yeasts). The C. glabrata/macrophage ratio was 10:1. Significance was determined with the Mann-Whitney U test. Values represent means ± SEM (n = 5 mice per group). (B) Migration of peritoneal macrophages was determined using live-cell video microscopy. Tracking diagrams illustrate the distances traveled and the directionality and velocity of macrophages exposed to C. glabrata at a fungal particle/macrophage ratio of 3:1. Due to the large number of macrophages tracked per video, the data were filtered to show only macrophages whose tracks lasted until 30 min to 60 min, as previous work has shown that migration activity is greater early on (25). Tracks represent the movement of individual macrophages relative to their starting position, symbols indicate the location of macrophages at 1-min intervals, and arrows represent directionality. (n = 7 control mice and n = 8 Dectin-2−/− mice for 4 independent experiments). (C and D) Percentage of uptake (C) and phagocytic index (D) determined using live-cell video microscopy. The percentage of macrophages that have ingested at least one C. glabrata and the number of C. glabrata per 100 macrophages are depicted. Significance was determined with the Mann-Whitney U test. Values represent means ± SEM. *, P < 0.05.

